The Grid
At the heart of Adslot products are grids of advertising data that needs to be created, explored, sliced up, and exported by users in a variety of ways. This is done as they progress through the many stages of planning and executing Advertising Campaigns. The current state of the grid system varied from product to product and had fallen out of step with Industry best practices set by companies such as Excel, Google Sheets and Airtable.
The current state of affairs
Our aim was to bring our products closer together giving them similar looks, feel, and patterns but different nuances when it comes to workflow and user goals.
Below are screen grabs of how our products looked at the beginning of the grid project.
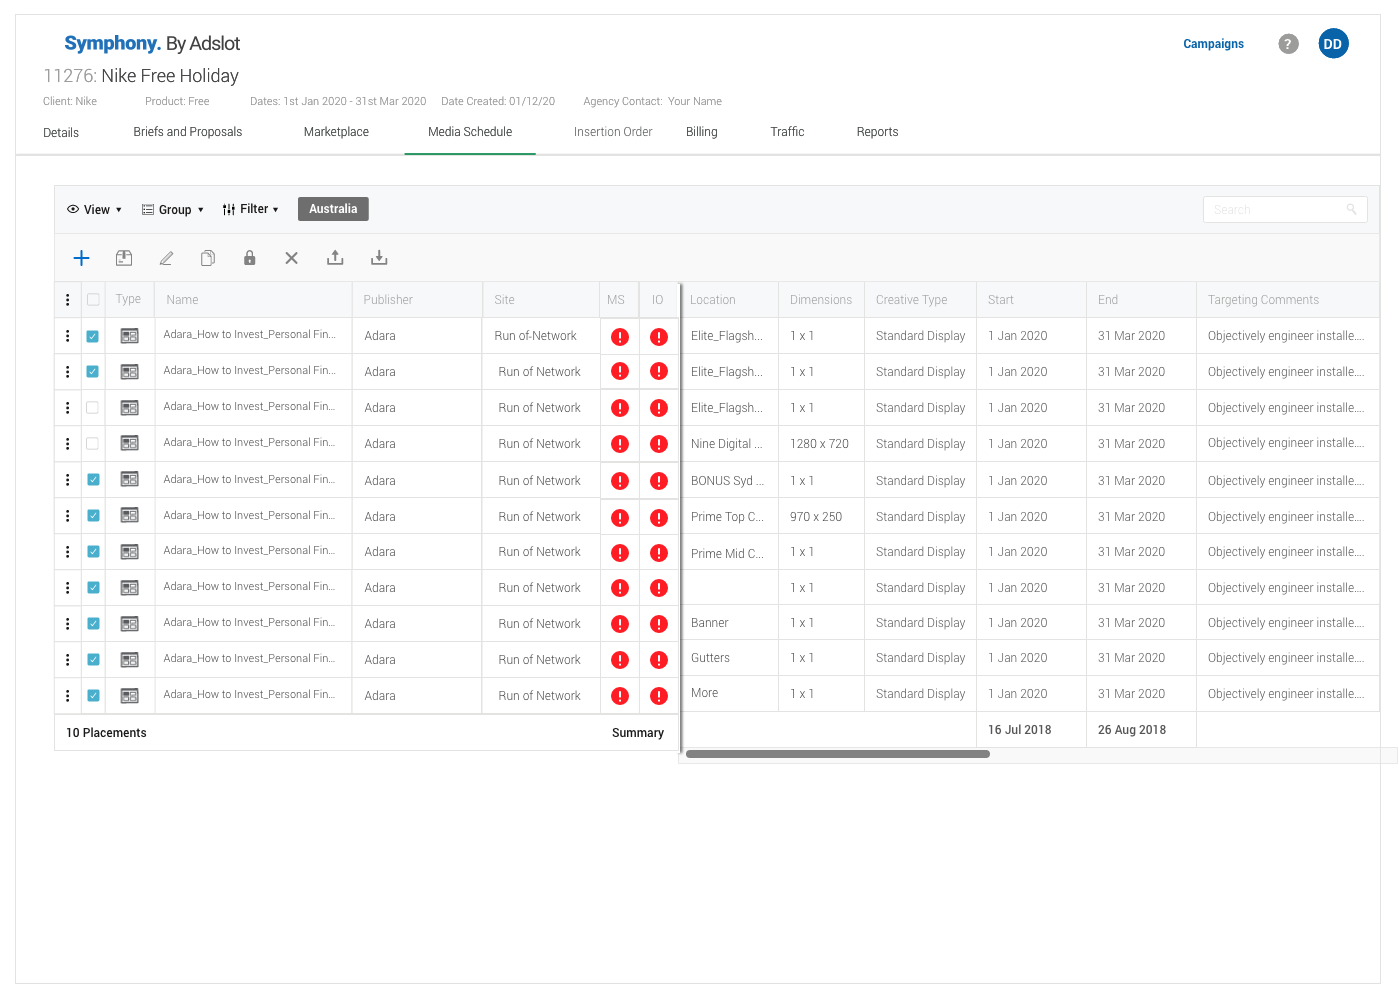
Below is Symphony, a 10-year-old legacy product built over time in line with the needs of its large growing corporate user base.

Differing from that is Adslot Media and Publisher built from the ground up aimed at providing a new media trading experience with a goal of revolutionizing how media is traded online.

Empathising
Drawing on our own previous persona research as well as industry level research available we were able to give all members of the teams a clear understanding of not just the new design patterns and technology we would be implementing but also the users it would be impacting and the problems they face.


Global best practices
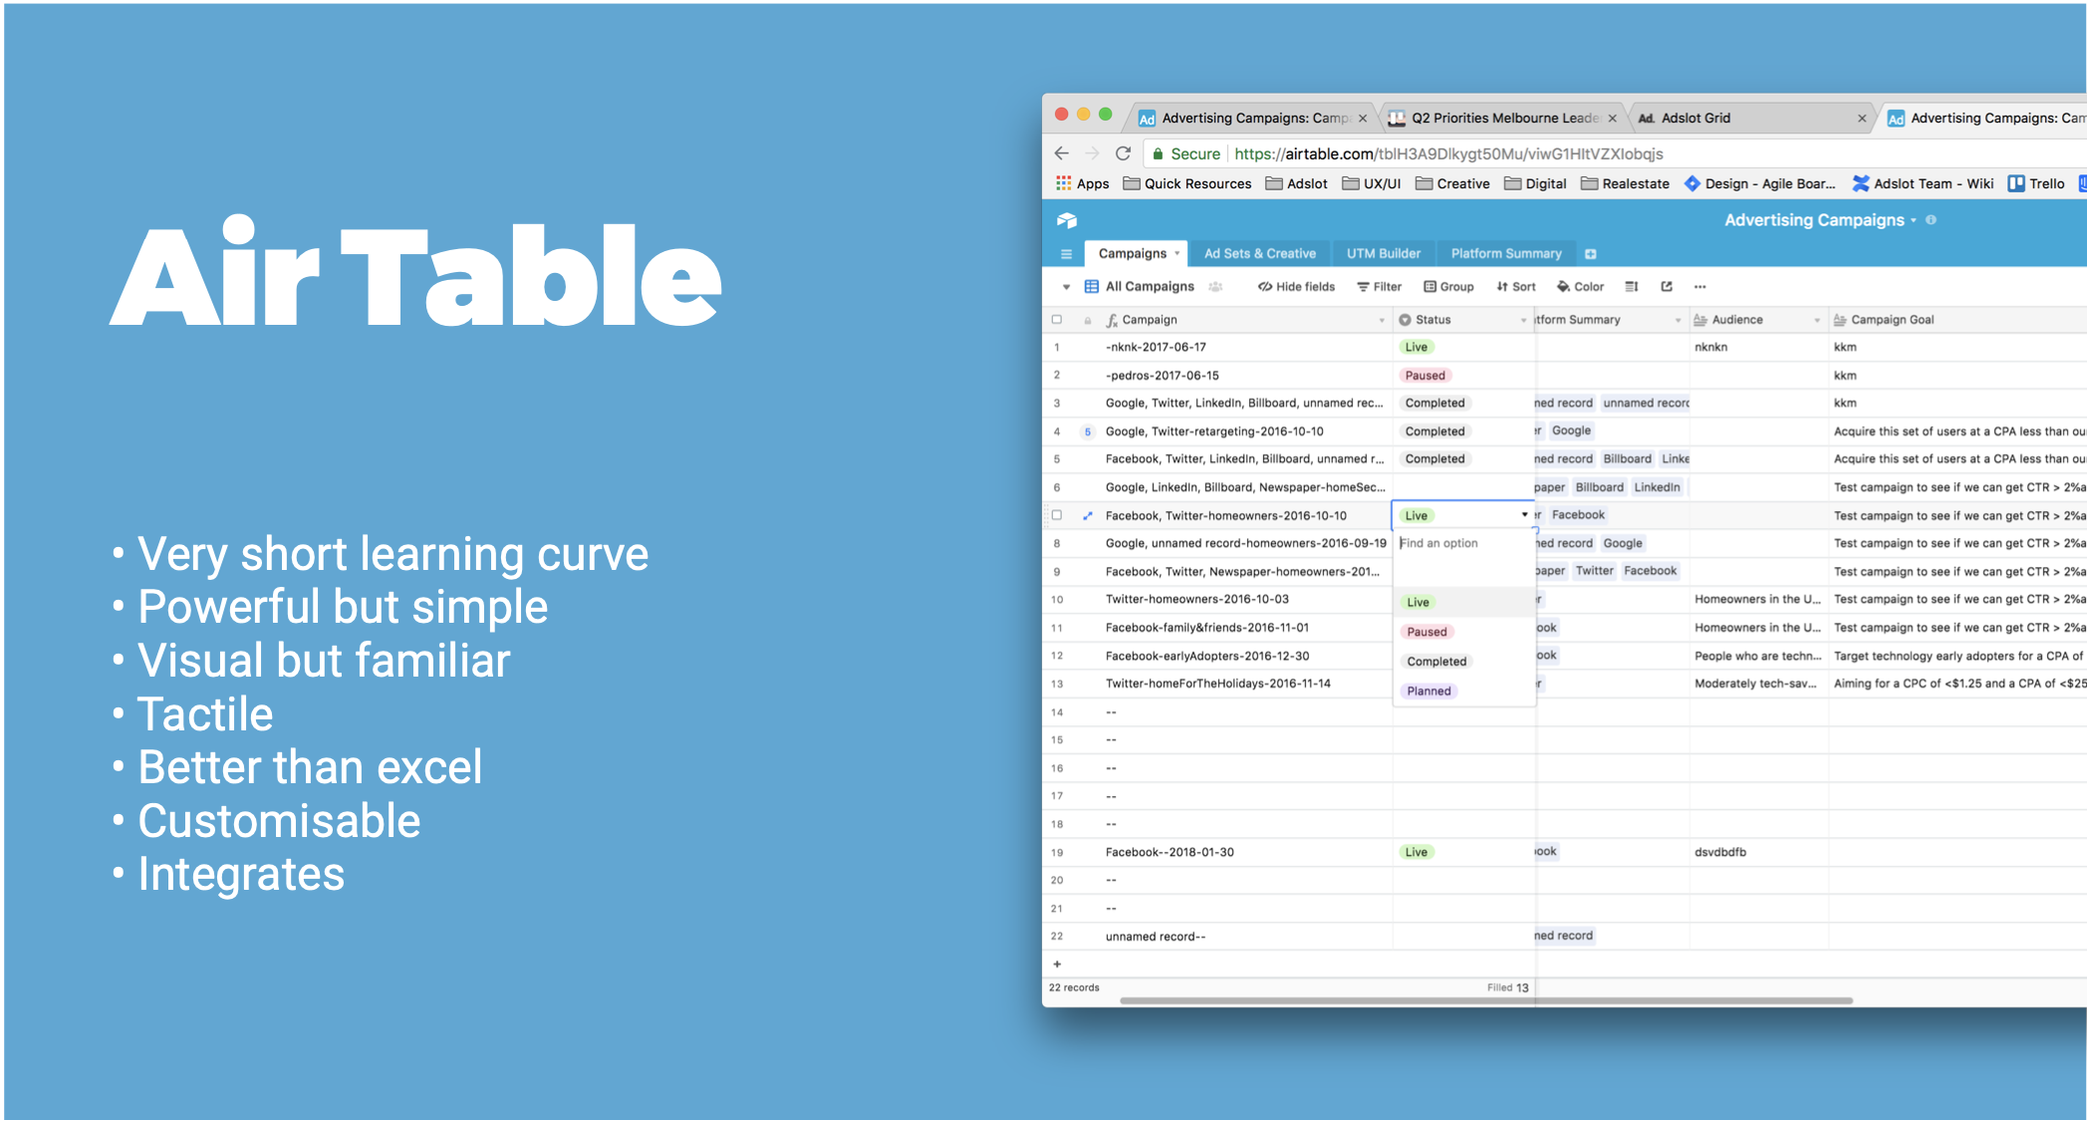
Before entering into any Research or Design we looked at the current solutions being used globally when Planning, Executing and Optimising digital Advertising campaigns. These are largely spreadsheeting tools such as Google Sheets , Microsoft Excel and Airtable.

Designing the grid component
Now that we understood the current competitors and the patterns used to solve the main problems our users faced we set to work designing our solution. Below is a compiled list of the most important goals we needed to achieve to allow us to create a competitive grid system that could be used in our products.
THE 20% OF THE PROBLEMS WE NEED TO SOLVE TO COVER 80% OF THE USE CASES.
Better display of more data.
Customisability of data displays by user.
Editing and adding inline.
Filtering, grouping and searching.
Increased performance on large data sets.
Increased scalability.
Inline real-time reporting.
Allow users to negotiate and collaborate faster.
Drive immediate action in the grid when required.
Versioning of plans.
Duplicating rows.
Features
To add functionality that would solve these problems the grid would need a variety of features that enabled different functionality when required.
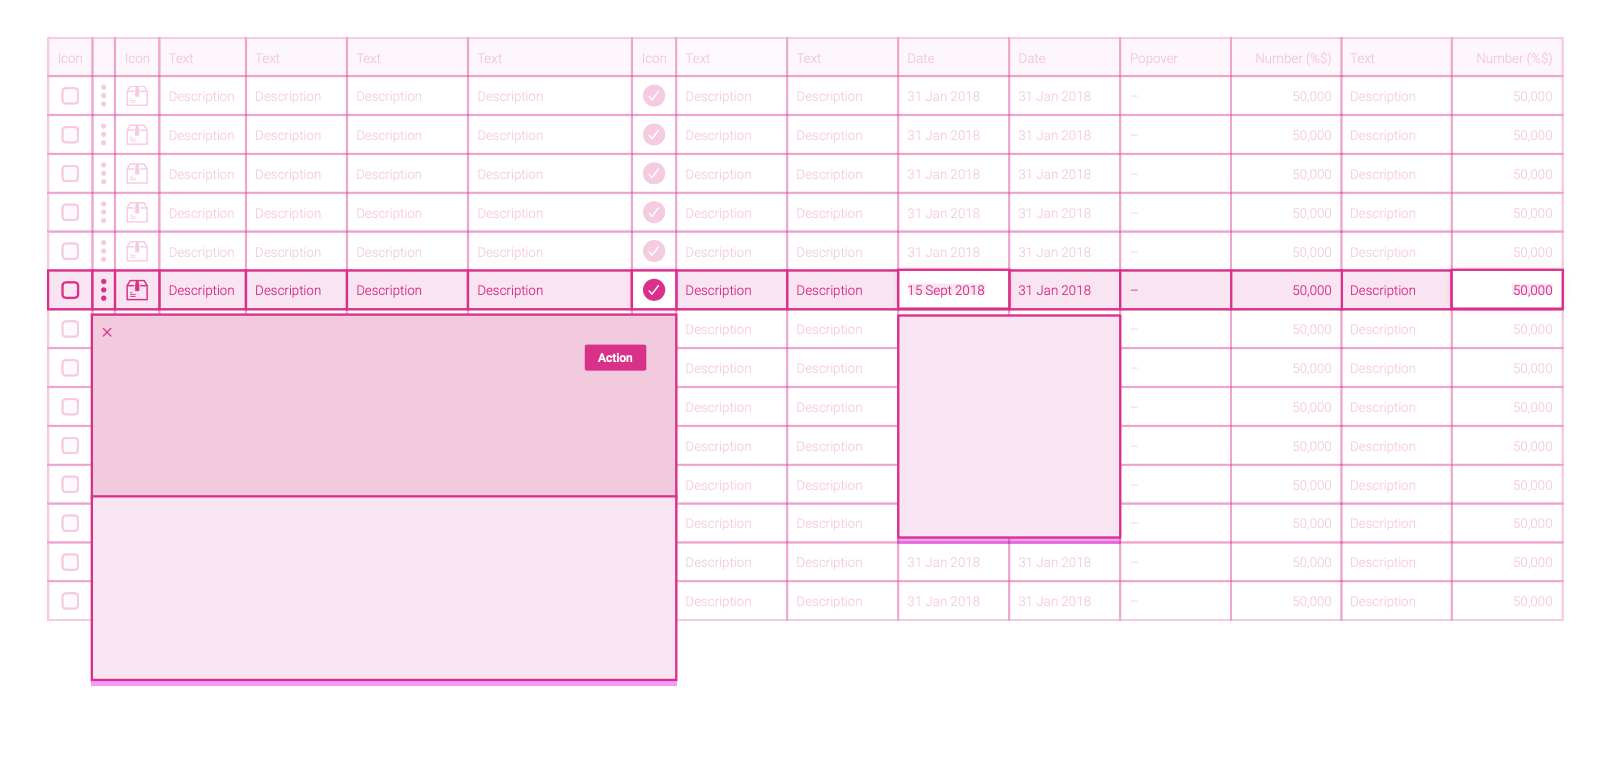
The grid can be thought of as a major component however housed within it are many smaller components that make it work. These smaller components are reusable on different pieces of data allowing users the ability to explore, add, edit and remove data in various forms. They also create a common patterns across any data set meaning once a user familiarises themselves with a tool, they can use it anywhere they want in the platform.


High fidelity designs
Working alongside development to ensure feasibility we designed the grid and began implementing it as a replacement across the products.
The grid takes hold
After proof of concepts were ran by some teams development adopted the grid as a component by default when it naturally lowered effort and developemnt time on their features.